

Why Profiling Deep Learning Models?
With the growing complexity of today’s deep learning models, the aspect of model inference latency is more relevant than ever. Therefore, profiling your machine learning model for bottlenecks can save you milliseconds during your prediction requests, and it saved you ultimately real money when it comes to deploying your model in a production scenario (and CO2 emissions too).
Keras already provides a stellar callback function to hook the training up to TensorBoard. This connection allows you to profile your model’s performance during the training phase. However, this profiler setup only tells you half the story.
If you use the TensorBoard callback to profile your machine learning model, all TensorFlow ops used during the backward pass will be part of the profiling. For example, you’ll find optimizer ops muddled in those profiling stats and some of the ops might show a very different profile because they are executed on a GPU instead of a CPU. The information is extremely helpful if you want to optimize for more efficient training patterns, but less helpful to reduce your serving latency.
One of the many amazing features of TensorFlow Serving is the integrated TensorFlow Profiler. TensorFlow Profiler can connect to your TensorFlow Serving instance and profile your inference requests. Through this setup, you can investigate all inference-related ops and it mimics the deployment scenario better than profiling your model during the training phase.
I am often using VSCode to connect to my GPUs, but unfortunately, the TensorBoard integration in VSCode couldn’t connect to TensorFlow Serving, therefore I looked for a different setup. Here is how you can set it up.
Prerequisites
For the purpose of this post, I created a demo model based on the code below. Don’t replicate the model, but rather make sure you save your TensorFlow or JAX model in the savedModel format which TensorFlow Serving can load.
import tensorflow as tf
import tensorflow_text as _
import tensorflow_hub as hub

text_input = tf.keras.layers.Input(shape=(), dtype=tf.string)
preprocessor = hub.KerasLayer(
    "https://tfhub.dev/tensorflow/bert_en_uncased_preprocess/3")
encoder_inputs = preprocessor(text_input)
encoder = hub.KerasLayer(
    "https://tfhub.dev/tensorflow/bert_en_uncased_L-12_H-768_A-12/4",
    trainable=True)
outputs = encoder(encoder_inputs)
sequence_output = outputs["sequence_output"]
embedding_model = tf.keras.Model(text_input, sequence_output)

embedding_model.save("/models/test_model/1/")
TensorBoard Setup
Once you have your model saved in a location where TensorFlow Serving can load it from, let’s set up your serving and TensorBoard. First, let’s create a Docker image to host TensorBoard.
FROM tensorflow/tensorflow:${TENSORFLOW_SERVING_VERSION}

RUN pip install -U tensorboard-plugin-profile

ENTRYPOINT [\"/usr/bin/python3\", \"-m\", \"tensorboard.main\", \"--logdir\", \"/tmp/tensorboard\", \"--bind_all\"]
TensorBoard doesn’t ship with the profiler anymore, therefore we need to install it separately.
Once you created the Docker image, we can use docker compose to spin up TensorFlow Serving together with the newly created TensorBoard image.
version: '3.3'
services:
  ${TENSORFLOW_SERVING_HOSTNAME}:
    image: tensorflow/serving:${TENSORFLOW_SERVING_VERSION}
    ports:
      - '8500:8500'
      - '8501:8501'
    environment:
      - MODEL_NAME=${TENSORFLOW_SERVING_MODEL_NAME}
    hostname: '${TENSORFLOW_SERVING_HOSTNAME}'
    volumes:
      - '/models/${TENSORFLOW_SERVING_MODEL_NAME}:/models/${TENSORFLOW_SERVING_MODEL_NAME}'
      - '${TENSORBOARD_LOGDIR}:/tmp/tensorboard'
    command:
      - '--xla_cpu_compilation_enabled'
      - '--tensorflow_intra_op_parallelism=${INTRA_OP_PARALLELISM}'
      - '--tensorflow_inter_op_parallelism=${INTER_OP_PARALLELISM}'
  profiler:
    image: ${DOCKER_PROFILER_TAG}
    ports:
      - '6006:6006'
    volumes:
      - '${TENSORBOARD_LOGDIR}:/tmp/tensorboard'
I like to add additional TensorFlow Serving command to mimic the full production setup as closely as possible. In this particular case, I enabled the XLA support, and limit the intra and inter ops parallelism in TensorFlow Serving. You can find more information about XLA here and details about all TensorFlow Serving options here.
command:
    - '--xla_cpu_compilation_enabled'
    - '--tensorflow_intra_op_parallelism=${INTRA_OP_PARALLELISM}'
    - '--tensorflow_inter_op_parallelism=${INTER_OP_PARALLELISM}'
You can find the full setup script in this Github Gist. Thanks to Kyle Jarvis for suggesting to run the two containers via docker-compose and for dynamically creating the docker-compose configuration.
Profile Your Model
If you copy this script from Github Gist to your local machine and execute it, it will start up a TensorFlow Serving instance that loads your model (adjust the model path in the script) and a TensorBoard instance as well.
In case, you are running this script remotely (like many M1 users), you need to create an ssh tunnel to access TensorBoard. If you are running on a Google Cloud instance, you can do this by running
$ gcloud compute ssh \
    --project=digits-data-science \
    --zone=us-central1-a \
    YOUR_INSTANCE_NAME
More information about connecting securely to Google Cloud instances can be found here.
If you run the docker compose setup on your machine locally, you can skip the previous step. If you running on an AWS EC2 instance, check here how to connect with your machine.
Once docker-compose is running, you should see a terminal output similar to this below.
If the serving or profiler container fails with an error, you’ll need to stop here and investigate. Both containers need to run for the next steps.
$ sh ./tensorboard.sh
mkdir -p /tmp/tensorboard
[+] Building 0.0s (6/6) FINISHED
 => [internal] load build definition from Dockerfile_tfprofile =>
 => transferring dockerfile:
 => [internal] load dockerignore
 => [internal] load metadata for docker.io/tensorflow/tensorflow:2.11.
 => [1/2] FROM docker.io/tensorflow/tensorflow:2.11.
 => CACHED [2/2] RUN pip install -U tensorboard-plugin-profile
 => exporting to image
 => => exporting layers
...
 => => naming to docker.io/library/tensorboard_profiler:latest
Starting 20230128_tfserving_profiling_serving_1    ... done
Recreating 20230128_tfserving_profiling_profiler_1 ... done
Attaching to 20230128_tfserving_profiling_serving_1, 20230128_tfserving_profiling_profiler_1
serving_1   | 2023-02-12 18:30:46.059050: I tensorflow_serving/model_servers/server.cc:74] Building single TensorFlow model file config:  model_name: test_model model_base_path: /models/test_model
...
serving_1   | 2023-02-12 18:30:48.495900: I external/org_tensorflow/tensorflow/cc/saved_model/loader.cc:213] Running initialization op on SavedModel bundle at path: /models/test_model/1
serving_1   | 2023-02-12 18:30:49.073199: I external/org_tensorflow/tensorflow/cc/saved_model/loader.cc:305] SavedModel load for tags { serve }; Status: success: OK. Took 2803691 microseconds.
...
serving_1   | 2023-02-12 18:30:49.296815: I tensorflow_serving/model_servers/server.cc:383] Profiler service is enabled
serving_1   | 2023-02-12 18:30:49.298806: I tensorflow_serving/model_servers/server.cc:409] Running gRPC ModelServer at 0.0.0.0:8500 ...
serving_1   | [warn] getaddrinfo: address family for nodename not supported
serving_1   | 2023-02-12 18:30:49.300120: I tensorflow_serving/model_servers/server.cc:430] Exporting HTTP/REST API at:localhost:8501 ...
serving_1   | [evhttp_server.cc : 245] NET_LOG: Entering the event loop ...
If both containers are running, head over to your browser and access http://localhost:6006.
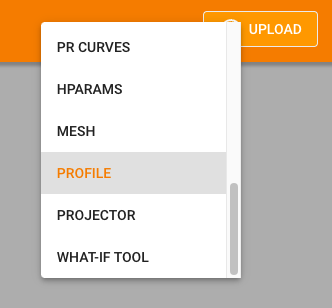
You can start the TensorBoard Profiler by selecting PROFILE from the top right menu.
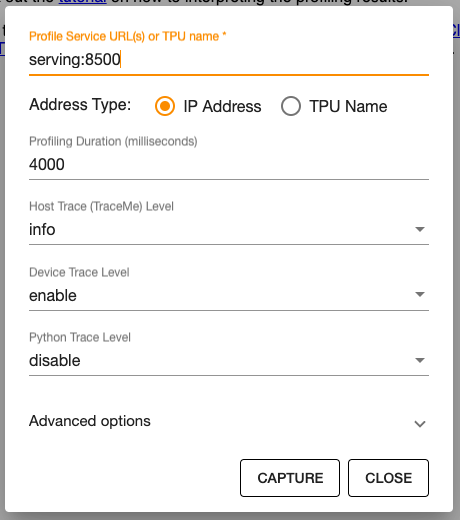
When you selected PROFILE, it will open a menu to configure your Profiler session. If you use the provided script, the hostname is serving. By default, TensorBoard profiles for 1s. This is fairly short this it takes some time to kick off an inference. I usually use 4000ms as a profiling duration.
After you hit CAPTURE, submit an prediction request to your TensorFlow Serving setup. You can do this with the following curl command.
$ curl -X POST --data '{"instances": ["This is a request for profiling purposes"]}' http://localhost:8501/v1/models/test_model:predict
If your payload is more than a few characters, save it in a JSON formatted file (here data.json). curl can load the file and submit it as the request payload.
$ curl -X POST --data @data.json http://localhost:8501/v1/models/test_model:predict
A few seconds after you submitted your curl request, you’ll be provided with a variety of profiling details in TensorBoard. The TensorFlow Stats and the Tracer are the most insightful.
The TensorFlow Stats tell you, what ops are used most often. This provides you with details on how you could optimize your machine-learning model.
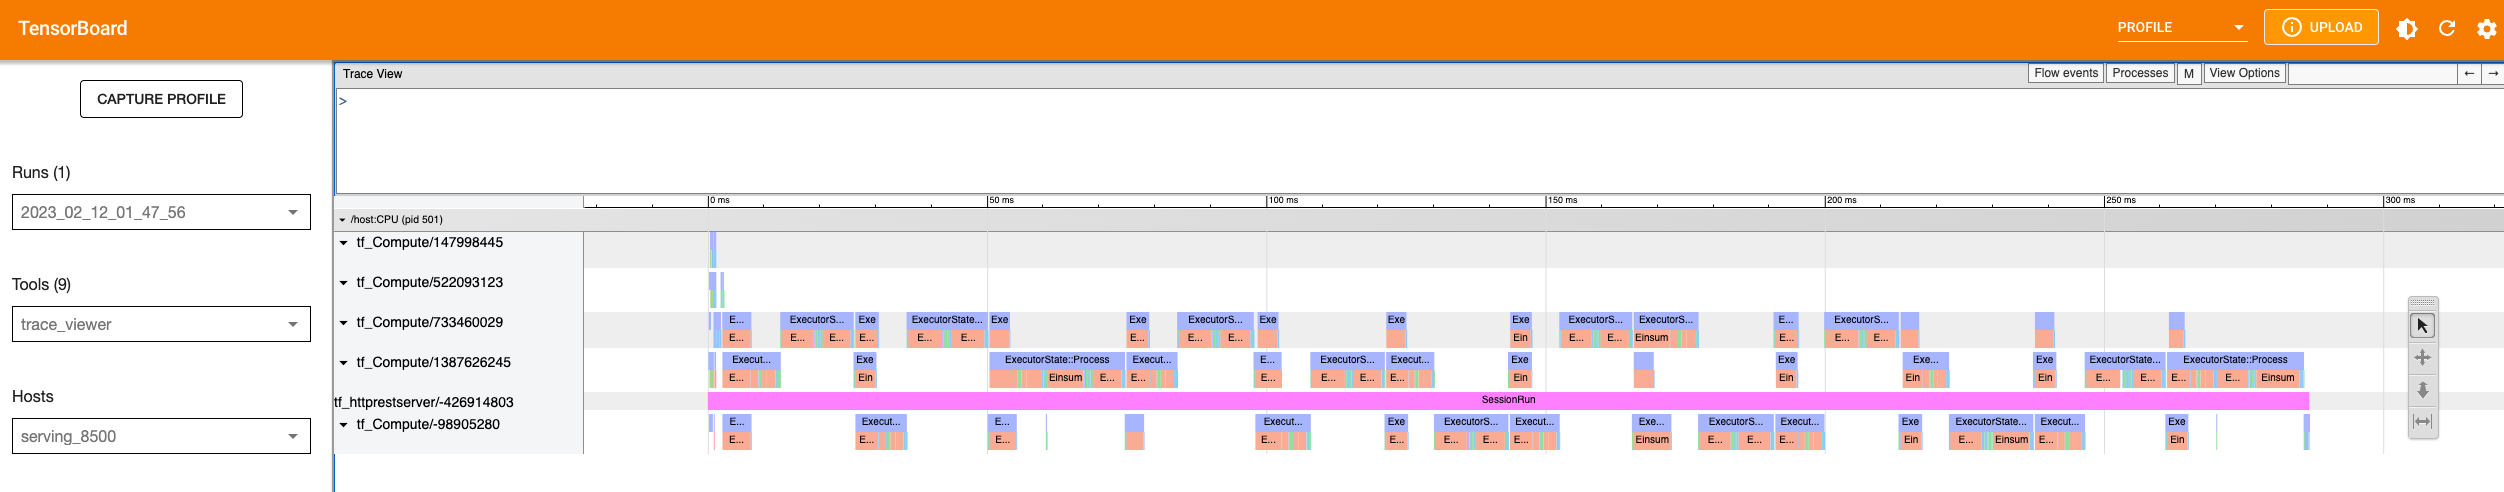
The Tracer shows every TensorFlow ops in its sequence. Here you can see the trace of a BERT model with its 12 layers.
You can then zoom into any section of interest. For example, I am always checking how much time is taken up by the preprocessing step in the model.
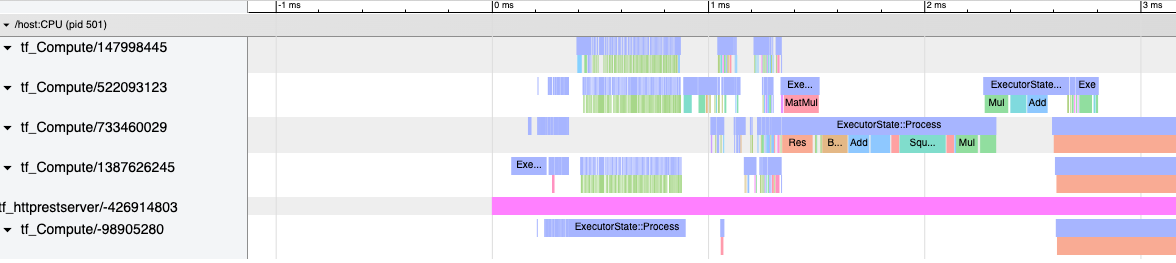
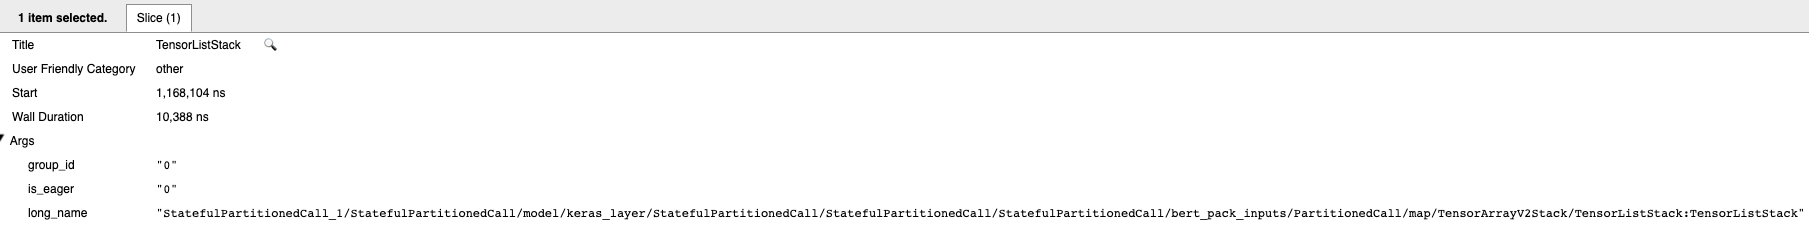
You can then click on every ops and drill into the specific details. You might be surprised by what surprises you can sometimes discover.
Happy profiling :)
Further Reading
Header image by Nicolas Hoizey on Unsplash


